Data Analytics
Time Series Analysis: A Guide to Strategic Business Forecasting
In today's business world, using time series analysis is like having a secret weapon. It helps companies make smart decisions and plan. Let's take a closer look at what time series analysis is and why it's so important for forecasting in business.
Understanding Time Series Analysis
Time series analysis is all about looking at data collected over time to find patterns and trends. For example, think about tracking sales numbers each month or monitoring stock prices every day. Time series analysis helps us understand what's going on behind these numbers.
Key Concepts in Time Series Analysis
1.Components of Time Series
Trend: This is the overall direction that the data is moving in over time.
Seasonality: These are patterns that repeat at regular intervals, like every week or every year.
Cyclic Patterns: Cyclic patterns in time series are long-term fluctuations influenced by economic conditions, lacking fixed intervals, and lasting years or decades. The cyclic variation may be regular are not periodic.
Irregular Fluctuations: These are random changes in the data that don't fit into any of the other categories.
2.Stationarity
Time series data needs to be stable for accurate analysis. This means that the average and variation in the data should stay consistent over time. We can use techniques like differencing to make the data more stable.
3.Autocorrelation
This is about how each data point is related to the ones that came before it. It helps us see if there's a pattern or trend in the data.
Forecasting Methods
1.Moving Average (MA) and Exponential Smoothing
These methods are simple yet effective for forecasting.
Moving Average (MA): It calculates the average of a specified number of recent data points to predict future values. By focusing on recent data, it provides a smooth estimate of the underlying trend.
Exponential SmoothingThis method gives more weight to recent observations while exponentially decreasing the weight of older observations. It's particularly useful for capturing short-term fluctuations and is adaptable to changing trends over time.
2.Autoregressive Integrated Moving Average (ARIMA)
ARIMA is a comprehensive method that combines three key components - autoregression, differencing, and moving average - to forecast future values.
Autoregression: It predicts future values by analysing and modelling the relationship between current and past values of the variable being forecasted using a linear combination of autoregressive parameters and an error term.
Differencing: This process transforms non-stationary time series data into stationary data by computing the difference between consecutive observations.
Moving Average: It accounts for random fluctuations in the data by averaging out noise over time.
3.Seasonal ARIMA (SARIMA) and Seasonal Decomposition of Time Series (STL)
These techniques are extensions of ARIMA tailored to handle seasonal patterns.
Seasonal ARIMA (SARIMA): It extends ARIMA by incorporating seasonal factors into the model. SARIMA considers seasonal trends in addition to the non-seasonal components, enabling more accurate forecasting for data with predictable seasonal variations.
Seasonal Decomposition of Time Series (STL): STL decomposes the time series into seasonal, trend, and residual components. By separating these elements, it allows for a clearer understanding of the underlying patterns and facilitates more precise forecasting.
Advanced Techniques
1.Seasonal Exponential Smoothing (ETS)
ETS is an advanced forecasting method that combines exponential smoothing with seasonality.
Exponential Smoothing: Similar to the basic exponential smoothing method, ETS gives more weight to recent observations. However, it also incorporates seasonal patterns into the smoothing process, making it suitable for data with both trend and seasonal components.
2.Prophet
Prophet is an advanced forecasting tool developed by Facebook that excels in handling complex patterns like holidays and unusual events.Prophet utilizes a decomposable time series model with separate components for trend, seasonality, and holidays. It automatically detects patterns and adjusts forecasts accordingly, making it robust against irregularities in the data.
3.Long Short-Term Memory (LSTM)
LSTM is a sophisticated artificial intelligence technique designed specifically for analysing sequences of data, such as time series.LSTM networks can capture long-term dependencies in sequential data by maintaining a memory of past observations. This makes them well-suited for forecasting tasks where historical context plays a crucial role in predicting future outcomes.
Time series analysis is a valuable tool for businesses in many ways
1.Demand Forecasting in Retail It helps stores predict how much of a product they'll need, so they don't run out or have too much left over.
2.Energy Consumption Forecasting: Utility companies use it to plan for how much energy people will use, so they can make sure there's enough to go around.
3.Financial Market Prediction: Banks and investors use it to guess what might happen to things like stock prices, so they can make smart decisions about where to put their money.
Embracing the Power of Time Series Analysis
In conclusion, time series analysis is a powerful tool for businesses. By understanding the basics and using the right techniques, companies can make better forecasts and plan with confidence.
Tags
- TimeSeriesAnalysis
- BusinessForecasting
- TrendAnalysis
- DemandForecasting
- ARIMA
- SARIMA
- LSTM
- MovingAverage
- In22labs
- PowerBI
- Data Analytics
- e-governance
Written by
Amit Siddharth
Published on
08 March 2024
Other Blogs

Data Analytics
|
08 March 2024
RFM Analysis in Ecommerce : Challenging the Big Spender Paradigm
Diving into the realm of ecommerce, it is crucial to look beyond just the big transactions. RFM Analysis emerg....
Read More
Data Analytics
|
08 March 2024
The Rise of AI in Data Analytics
Artificial intelligence comprises a range of technologies such as machine learning, deep learning, and natural....
Read More
Data Analytics
|
08 March 2024
Beyond Numbers: Understanding Metrics in Modern Marketing Analytics
In the ever-evolving landscape of marketing, the ability to concentrate more on measuring the relevant metrics....
Read More
Data Analytics
|
08 March 2024
Crafting an Effective Data Strategy for Value Creation
Data is of utmost importance in the dynamic world of business. It's not just about collecting information anym....
Read More
Data Analytics
|
08 March 2024
Enhancing Algorithm Efficiency: Strategies for Optimization
In the field of computer science, algorithm optimization serves as a vital cornerstone, shaping the efficiency....
Read More
Data Analytics
|
08 March 2024
Prescriptive Analytics: The Pathway to Data-Driven Decision Making
As a part of our business intelligence solutions, we help businesses to make better decisions through the anal....
Read More
Data Analytics
|
08 March 2024
Understanding Text Analytics for Unstructured Data
In today's data-driven world, grasping customer needs, preferences, and emotions is crucial for businesses str....
Read More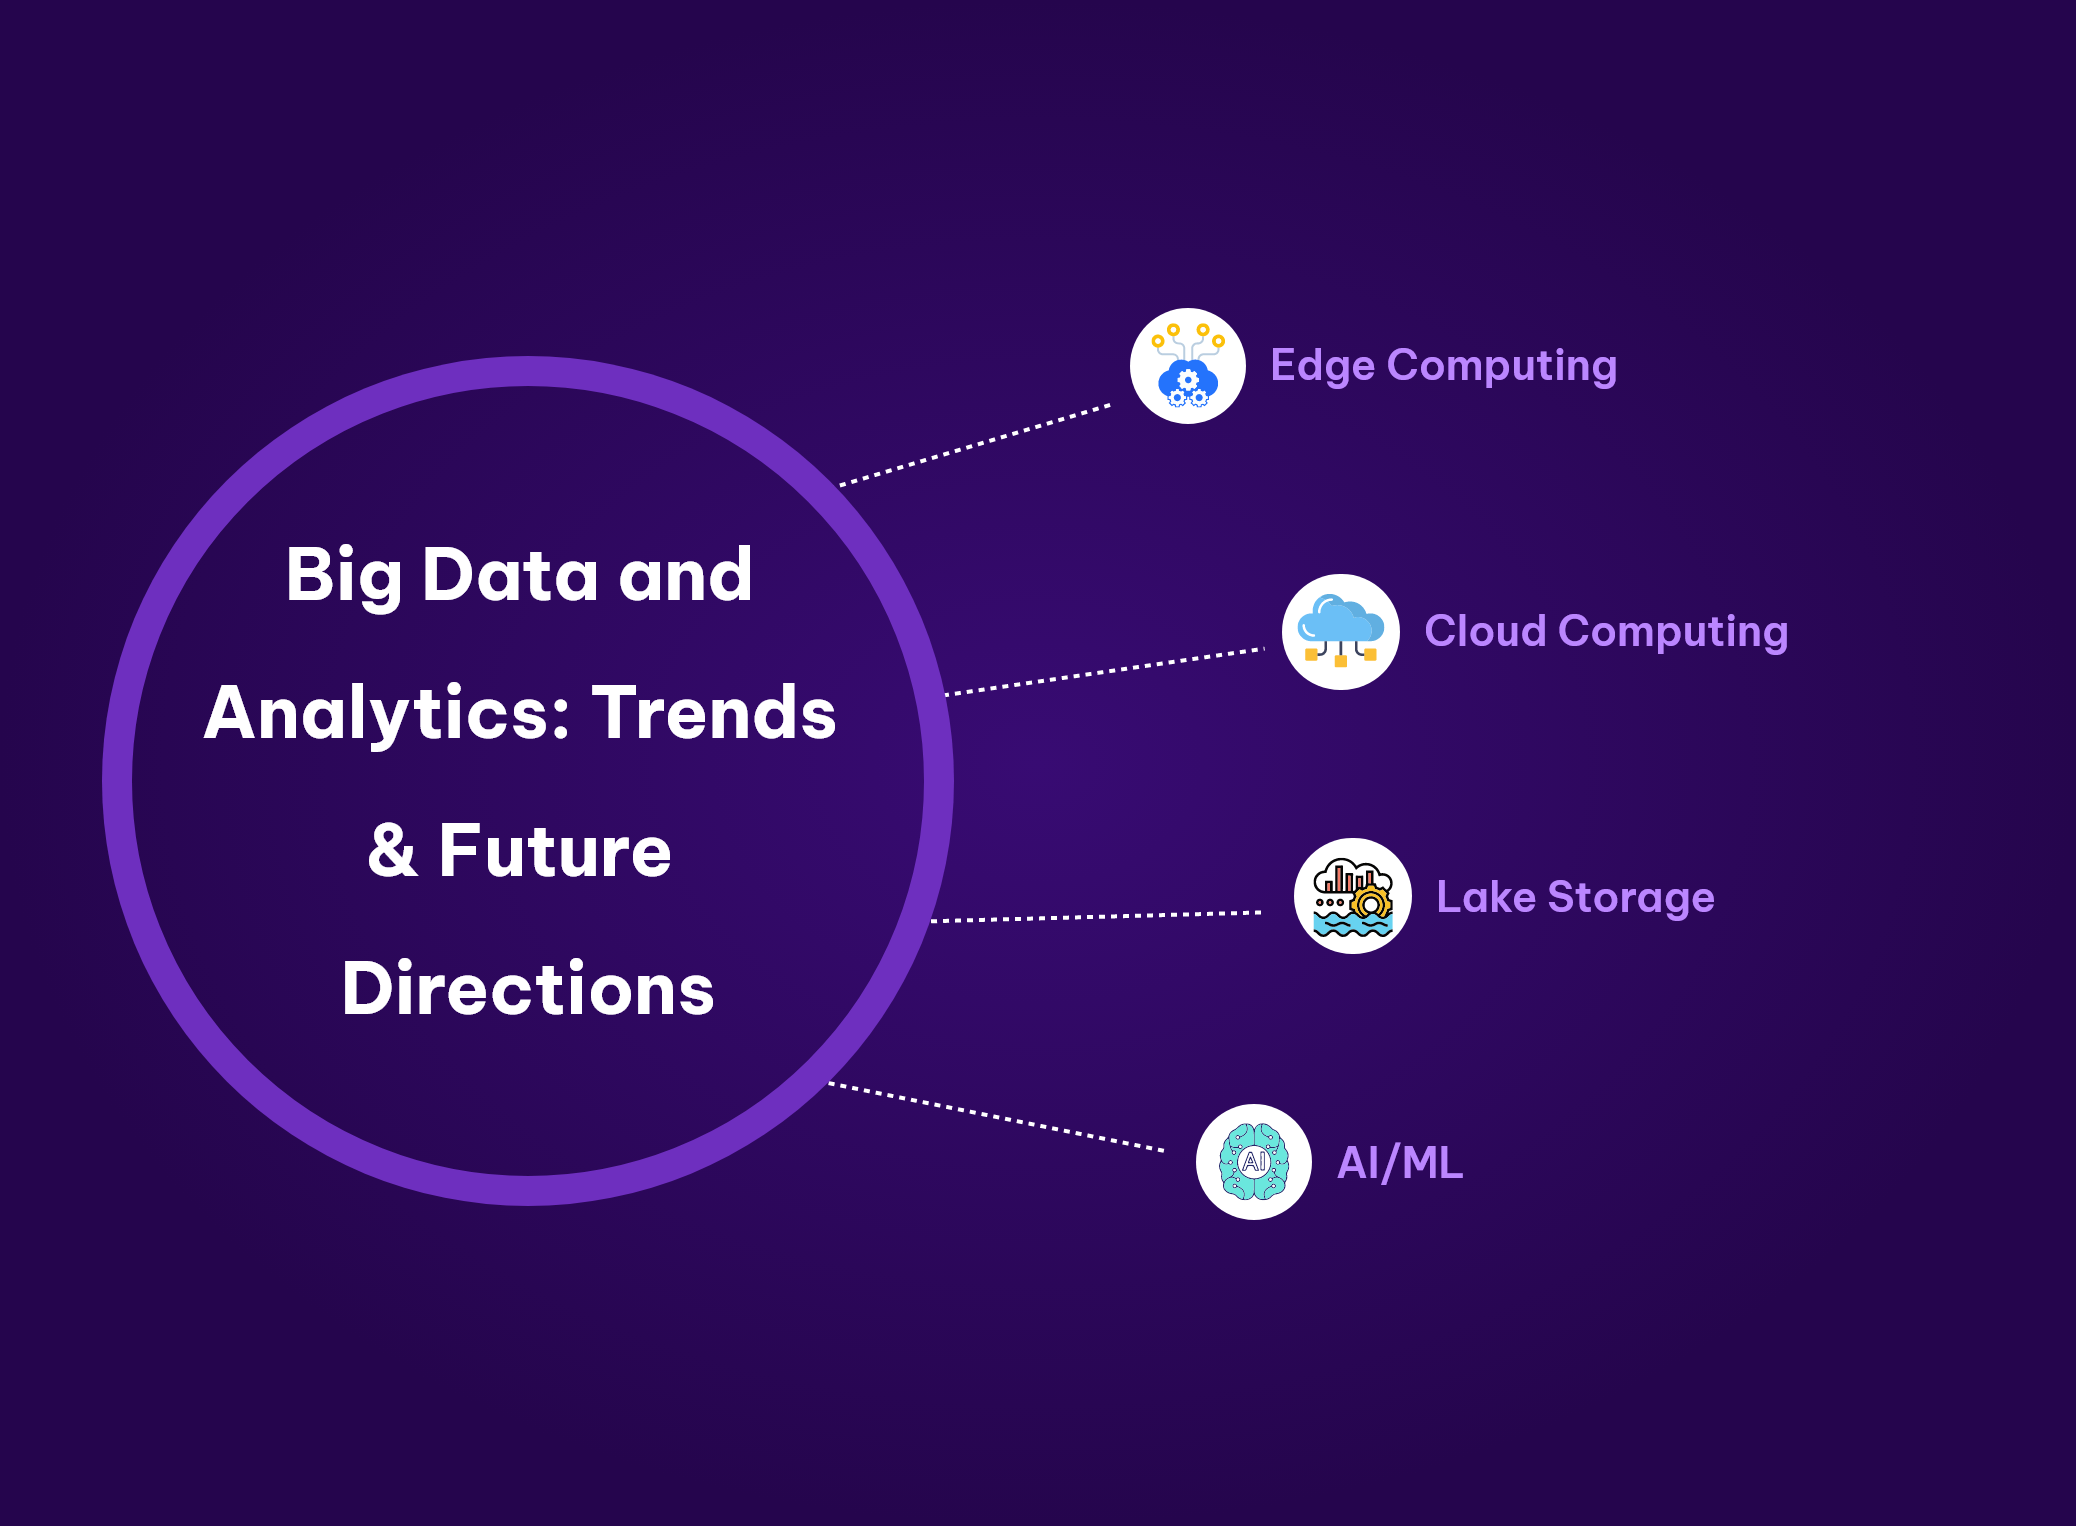
Data Analytics
|
08 March 2024
Big Data and Analytics: Trends and Future Directions
Big data is revolutionizing the way organizations process, store, and analyze information, leading to tangible....
Read More
Data Analytics
|
08 March 2024
The Essentials of Descriptive Analytics: A Beginner's Guide
As an umbrella concept, analytics helps businesses examine, analyse, and draw actionable insights from past in....
Read More
Data Analytics
|
08 March 2024
Data Analysis revolves around a Symbiotic Trio
Data analysis is not just a profession but an art form, intricately weaving together the fabric of reality wit....
Read More
Data Analytics
|
08 March 2024
Leveraging Business Intelligence in Retail Industry
Innovation in technology is advancing more quickly than before, and the digital revolution is having an impact....
Read More
Data Analytics
|
08 March 2024
Optimization Techniques for Power BI
Power BI stands as a powerhouse for business intelligence. However, to harness its full potential, it's crucia....
Read More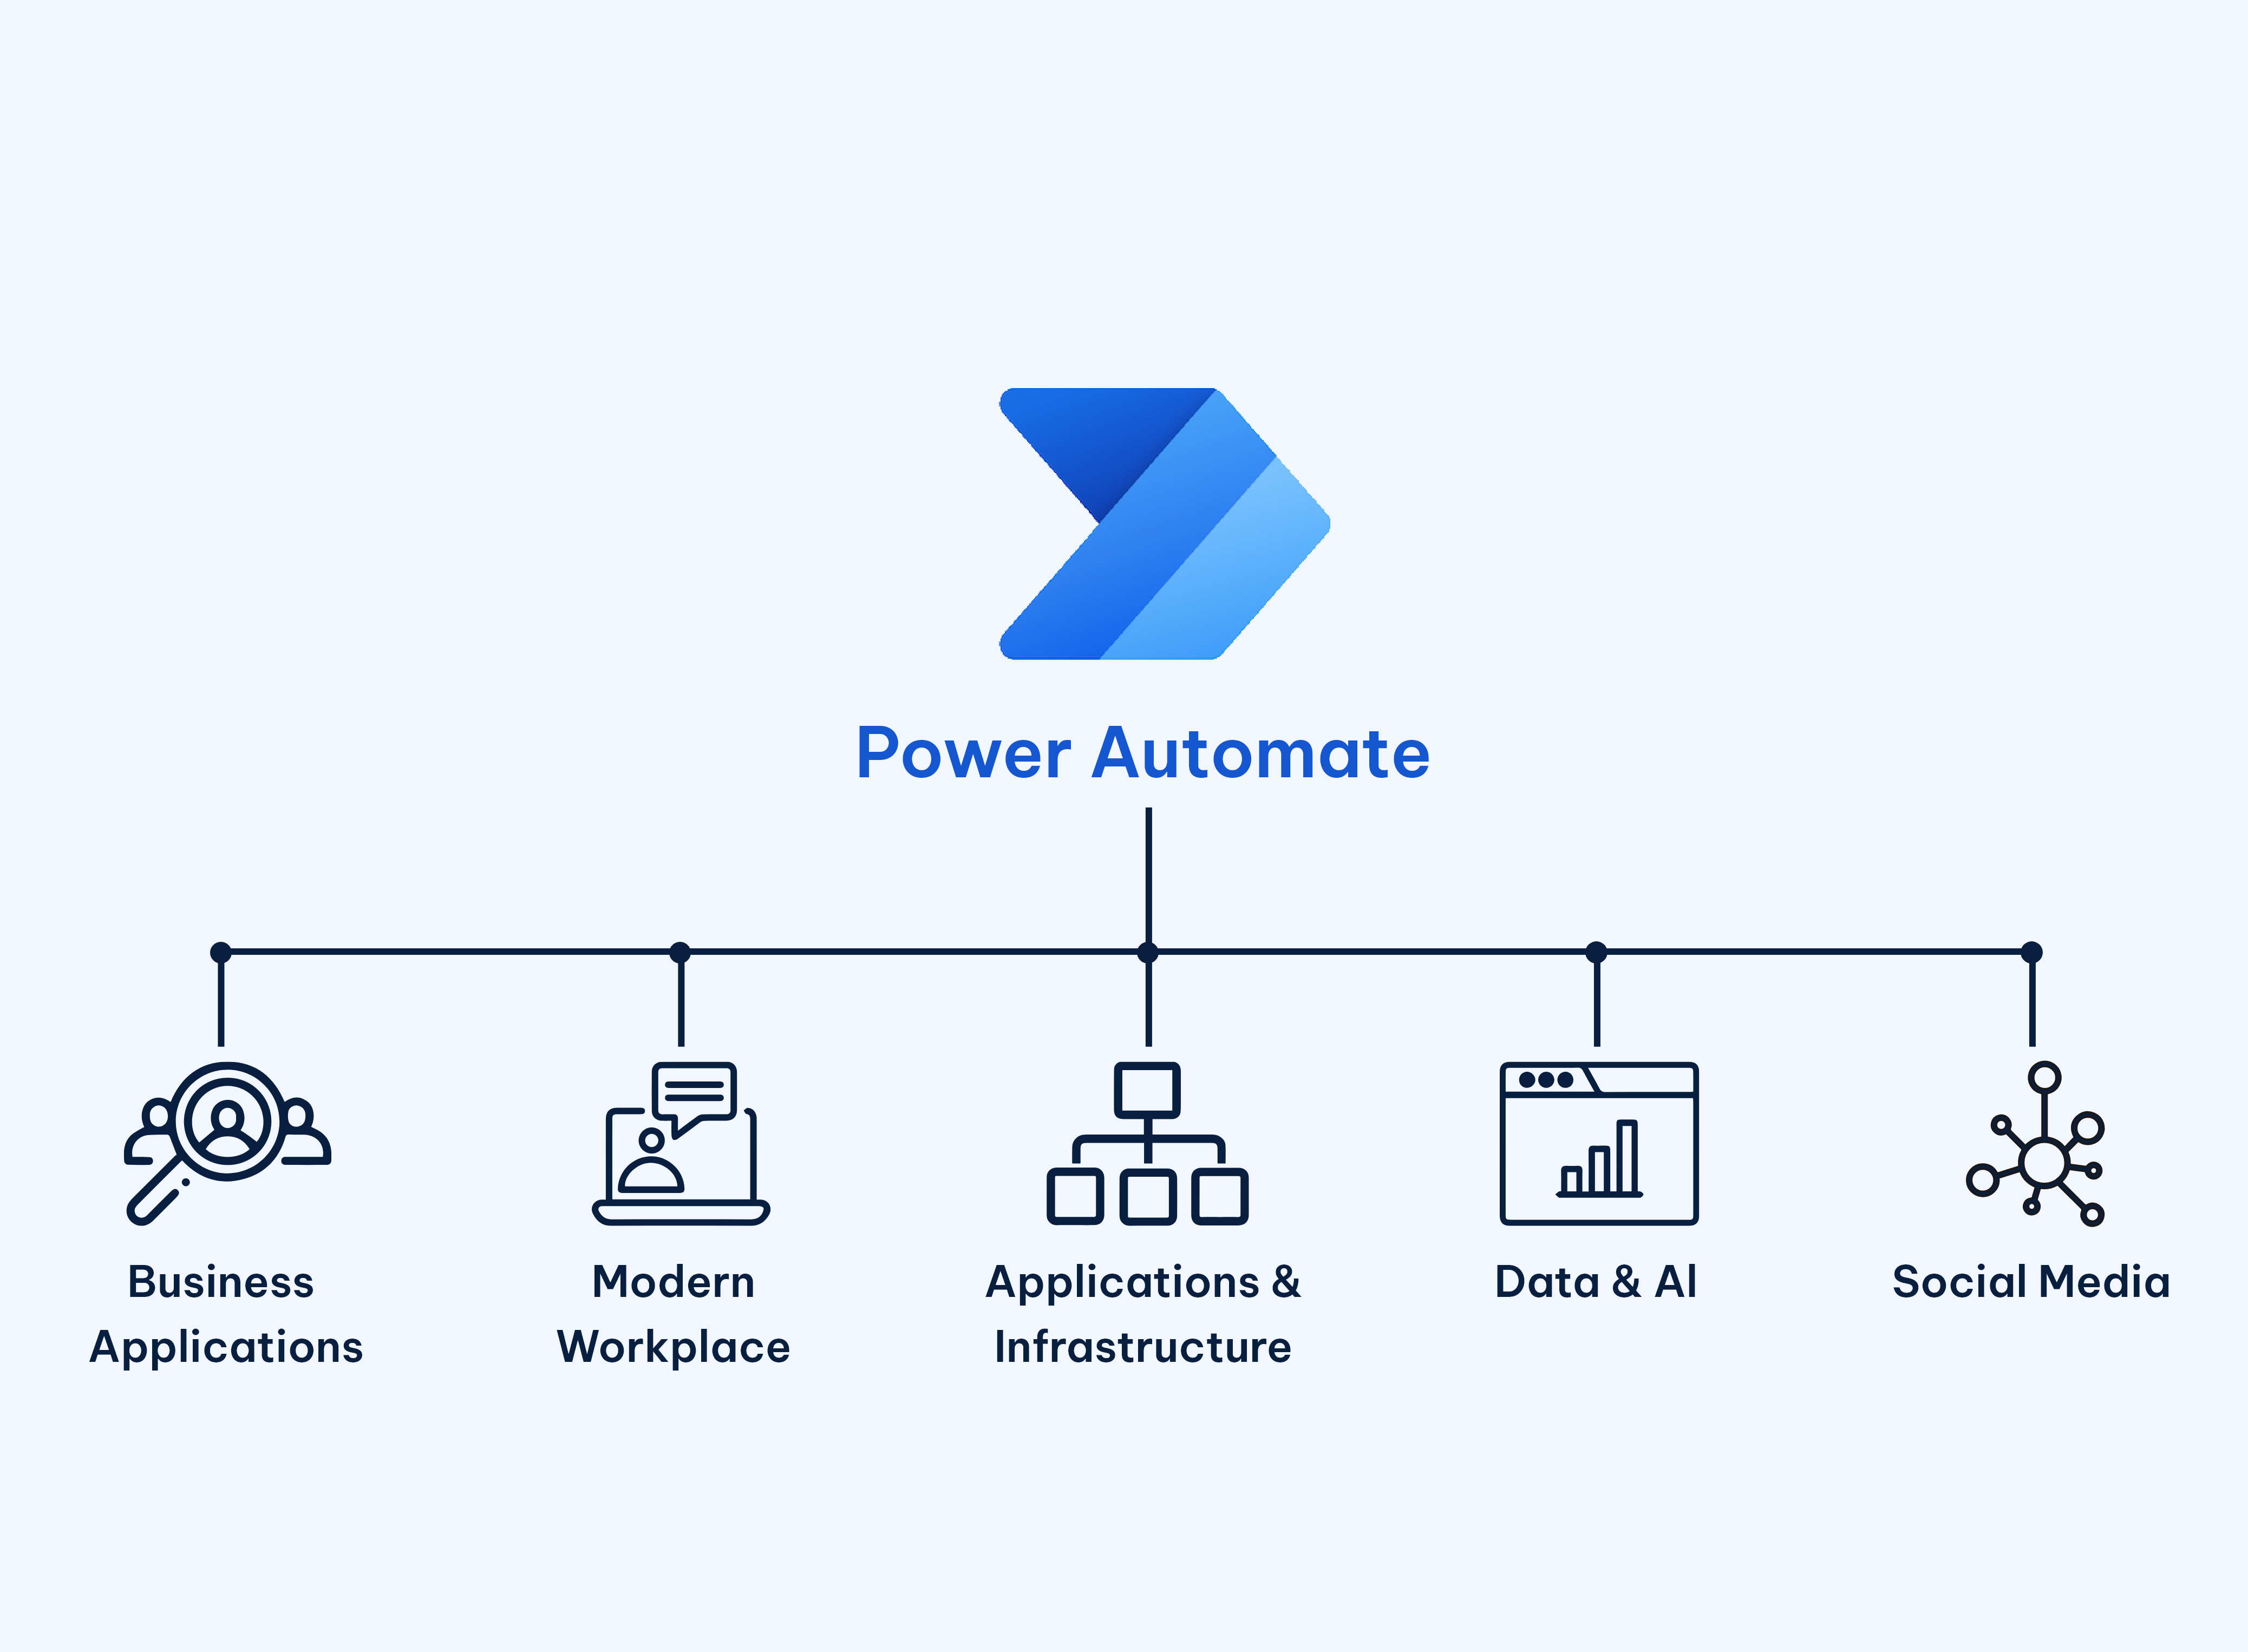
Data Analytics
|
08 March 2024
Automate Email reports with Microsoft Power Automate
Data shapes our professional choices and daily activities, offering insights into where to allocate time and r....
Read More
Data Analytics
|
08 March 2024
Big Data Processing with Apache Spark — the last journey through a fragmented data world
In today's business landscape, harnessing the power of big data is essential for driving innovation and genera....
Read More
Data Analytics
|
08 March 2024
Build a Learning Analytics Suite in 2024 for your Learning Management System
To foster a thriving learning culture, it's crucial to stay connected with your learners. Learning Management ....
Read More
Data Analytics
|
08 March 2024
Advanced SQL Techniques for Data Analyst
In the world of database management, mastering advanced SQL techniques can significantly enhance your ability ....
Read More
Data Analytics
|
08 March 2024
Beyond traditional analytics: A new era with Looker Studio
In the digital age, data is gold, but only if you can mine, refine, and present it in a way that's understanda....
Read More
Data Analytics
|
08 March 2024
The Future of Healthcare: Predictive Analytics for Personalized Medicine
In healthcare, technological advancements are playing a vital role in shaping the future of patient care. One ....
Read More
Data Analytics
|
08 March 2024
Data Analytics in the Entertainment Industry: A Game Changer
In the ever-evolving landscape of the entertainment industry, staying ahead of the curve is paramount for succ....
Read More
Data Analytics
|
08 March 2024
Digital Transformation for Businesses
Digital transformation has become an essential driver for success in today's world. It is the process of digit....
Read More
Data Analytics
|
08 March 2024
Optimizing Data Warehousing Solutions with Azure: In22labs' Billion-Data Challenge
In the field of data warehousing, effectively managing enormous volumes of unique data is a difficult task. We....
Read More
Data Analytics
|
08 March 2024
Synthetic Data Generation: Methods, Applications, and Quality Assurance
In today's data-centric landscape, synthetic data emerges as a crucial asset for organizations seeking to na....
Read More
Data Analytics
|
08 March 2024
How In22Labs Transformed Reporting and Monitoring for a Leading Chit Fund Company
In22Labs partnered with a leading Indian chit fund company to elevate their reporting from paper to digital wi....
Read More
Data Analytics
|
08 March 2024
Addressing Supply Chain Challenges with BI and Data Science Solutions
In today’s fast-paced, interconnected world, supply chains are the backbone of nearly every business, ensuring....
Read More
Data Analytics
|
08 March 2024
The Evolution of Customer Analytics in the Digital Age
In today's hyperconnected digital world, customer analytics has evolved into a cornerstone of business success....
Read More
Data Analytics
|
08 March 2024
Analytics in the Public Sector - Improving Government Sectors
In today's data-driven world, analytics has emerged as a game-changer for improving efficiency, decision-makin....
Read More