Data Analytics
Beyond traditional analytics: A new era with Looker Studio

In the digital age, data is gold, but only if you can mine, refine, and present it in a way that's understandable and actionable. Enter Looker Studio, Google Cloud's gem for turning raw data into visually stunning reports and dashboards. This blog post will guide you through the ins and outs of Looker Studio, shedding light on its key features. Whether you're comparing Looker Studio with Power BI, or curious about its place within the broader context of Looker and data analytics tools, you're in the right spot. Let's dive into the world of Looker Studio, where data meets design, and insights come alive.
Why Looker Studio?
Looker Studio is a free tool that turns the daunting task of data analysis into a seamless experience, allowing users to create interactive reports and dashboards that make data come alive. It's not just about presenting numbers; it's about telling a story that drives decision-making and strategy.
Key Features That Set Looker Studio Apart
Deployment Flexibility: Choose who gets to see your data with customizable sharing options. Whether it's making a dashboard public or limiting access to specific team members, you have control over your data's visibility.
Email Triggers: Stay ahead of the curve by setting up alerts for significant data changes. This proactive feature ensures that you and your team are always informed, allowing for timely decisions based on the latest insights.
Calculated Fields: In Looker Studio, you create calculated fields directly in your report or data source. These calculations are done using a range of functions provided by Looker Studio, which is similar to the one used in Google Sheets.
With calculated fields, Looker Studio offers a playground for data manipulation, enabling users to derive customized insights directly within their reports.
The Power of Calculated Fields
- Dynamic Calculations: The calculated field formula is applied to the data each time the data is loaded or refreshed in the report. This means that if your data source updates or changes, the calculated fields will automatically recalculate based on the latest data.
- Data Source Refresh: The frequency at which your data updates in Looker Studio depends on the data source's refresh settings. Different data sources have different refresh capabilities.
- Real-Time Data: If your data source supports real-time updates, the calculated fields in Looker Studio will reflect these changes as soon as the data is refreshed in the report.
Comparison to PowerBI
In Looker Studio the concepts similar to Power BI's "New Measure" and "New Column" are handled through "Calculated Fields". While Looker Studio doesn't differentiate between measures and columns in the same way as Power BI, you can create custom calculations that function similarly.
While Looker Studio offers the similar functions used in google sheets or excel, it's designed for accessibility over complexity. Advanced users accustomed to Power BI's DAX may find the calculations less intricate but will appreciate the user-friendly approach Looker Studio adopts.
Looker Studio's Connector Ecosystem
A pivotal aspect of Looker Studio's functionality is its ability to integrate with a wide array of data sources through connectors. These range from Google-native services like Google Sheets and Google Analytics to third-party connectors, offering a versatile foundation for pulling in data from diverse platforms. However, the extent and functionality of these connectors can vary, with some offering deeper integration and more frequent data refreshes than others.
Understanding Looker Studio's Limitations
While Looker Studio is a powerful tool for data visualization, it's also crucial to recognize its limitations, especially when compared to more sophisticated BI tools like Looker or Power BI
- Less sophisticated for Complex Models: For very complex data models or advanced analytical needs, Looker Studio's calculation capabilities might be less powerful compared to DAX in Power BI.
- Data Preparation: Sometimes, more complex data transformations might need to be done in the data source before bringing it into Looker Studio.
- Data Size and Complexity: Looker Studio might struggle with very large datasets or highly complex data models. Its performance can degrade with increased data size or complexity, leading to slower report loading times.
- API Limitations: There are limitations in API requests, which might impact how often data can be refreshed or how much data can be pulled in at a time.
Making the Choice: Looker Studio vs. Looker
Looker Studio provides a straightforward approach to data visualization, with limited options for data manipulation directly within the tool. It's optimized for users who prefer to work on pre-processed data or require quick insights without the need for advanced analytics.
Looker offers extensive capabilities for data manipulation, transformation, and complex model building. Its use of LookML allows for the development of reusable data models, ensuring consistency and accuracy across all analyses. This level of sophistication supports more complex business intelligence needs, such as:
- Creating detailed customer segmentation models
- Performing cohort analysis and lifetime value calculations
- Integrating machine learning models for predictive analytics
Looker Studio is your go-to for creating visual reports and dashboards that bring data to life, making it accessible to a broad audience. Looker, with its advanced data modelling and analytics capabilities, is the powerhouse behind deep data exploration and sophisticated analytics.
Choosing between Looker Studio and Looker—or better yet, understanding how to leverage them together—depends on your specific data analytics needs, from the simplicity of visualization to the complexity of modelling and analysis.
Conclusion: Your Path to Data Visualization Mastery with IN22 Labs
Embracing Looker Studio opens up a realm of possibilities for turning complex datasets into compelling narratives that drive strategic business decisions. At IN22 Labs, we extend our expertise beyond traditional analytics solutions like Power BI to include Looker Studio, offering our clients a comprehensive suite of data visualization tools. Our commitment to leveraging the latest technologies ensures that your business is equipped with the insights needed to thrive in a data-driven future. Explore the potential of your data with IN22 Labs, where innovation meets actionable intelligence. Contact us to discover how we can transform your data into a powerful asset for your business.
Tags
Written by
Rohini
Published on
16 February 2024
Other Blogs

Data Analytics
|
16 February 2024
RFM Analysis in Ecommerce : Challenging the Big Spender Paradigm
Diving into the realm of ecommerce, it is crucial to look beyond just the big transactions. RFM Analysis emerg....
Read More
Data Analytics
|
16 February 2024
Time Series Analysis: A Guide to Strategic Business Forecasting
In today's business world, using time series analysis is like having a secret weapon. It helps companies make ....
Read More
Data Analytics
|
16 February 2024
The Rise of AI in Data Analytics
Artificial intelligence comprises a range of technologies such as machine learning, deep learning, and natural....
Read More
Data Analytics
|
16 February 2024
Beyond Numbers: Understanding Metrics in Modern Marketing Analytics
In the ever-evolving landscape of marketing, the ability to concentrate more on measuring the relevant metrics....
Read More
Data Analytics
|
16 February 2024
Crafting an Effective Data Strategy for Value Creation
Data is of utmost importance in the dynamic world of business. It's not just about collecting information anym....
Read More
Data Analytics
|
16 February 2024
Enhancing Algorithm Efficiency: Strategies for Optimization
In the field of computer science, algorithm optimization serves as a vital cornerstone, shaping the efficiency....
Read More
Data Analytics
|
16 February 2024
Prescriptive Analytics: The Pathway to Data-Driven Decision Making
As a part of our business intelligence solutions, we help businesses to make better decisions through the anal....
Read More
Data Analytics
|
16 February 2024
Understanding Text Analytics for Unstructured Data
In today's data-driven world, grasping customer needs, preferences, and emotions is crucial for businesses str....
Read More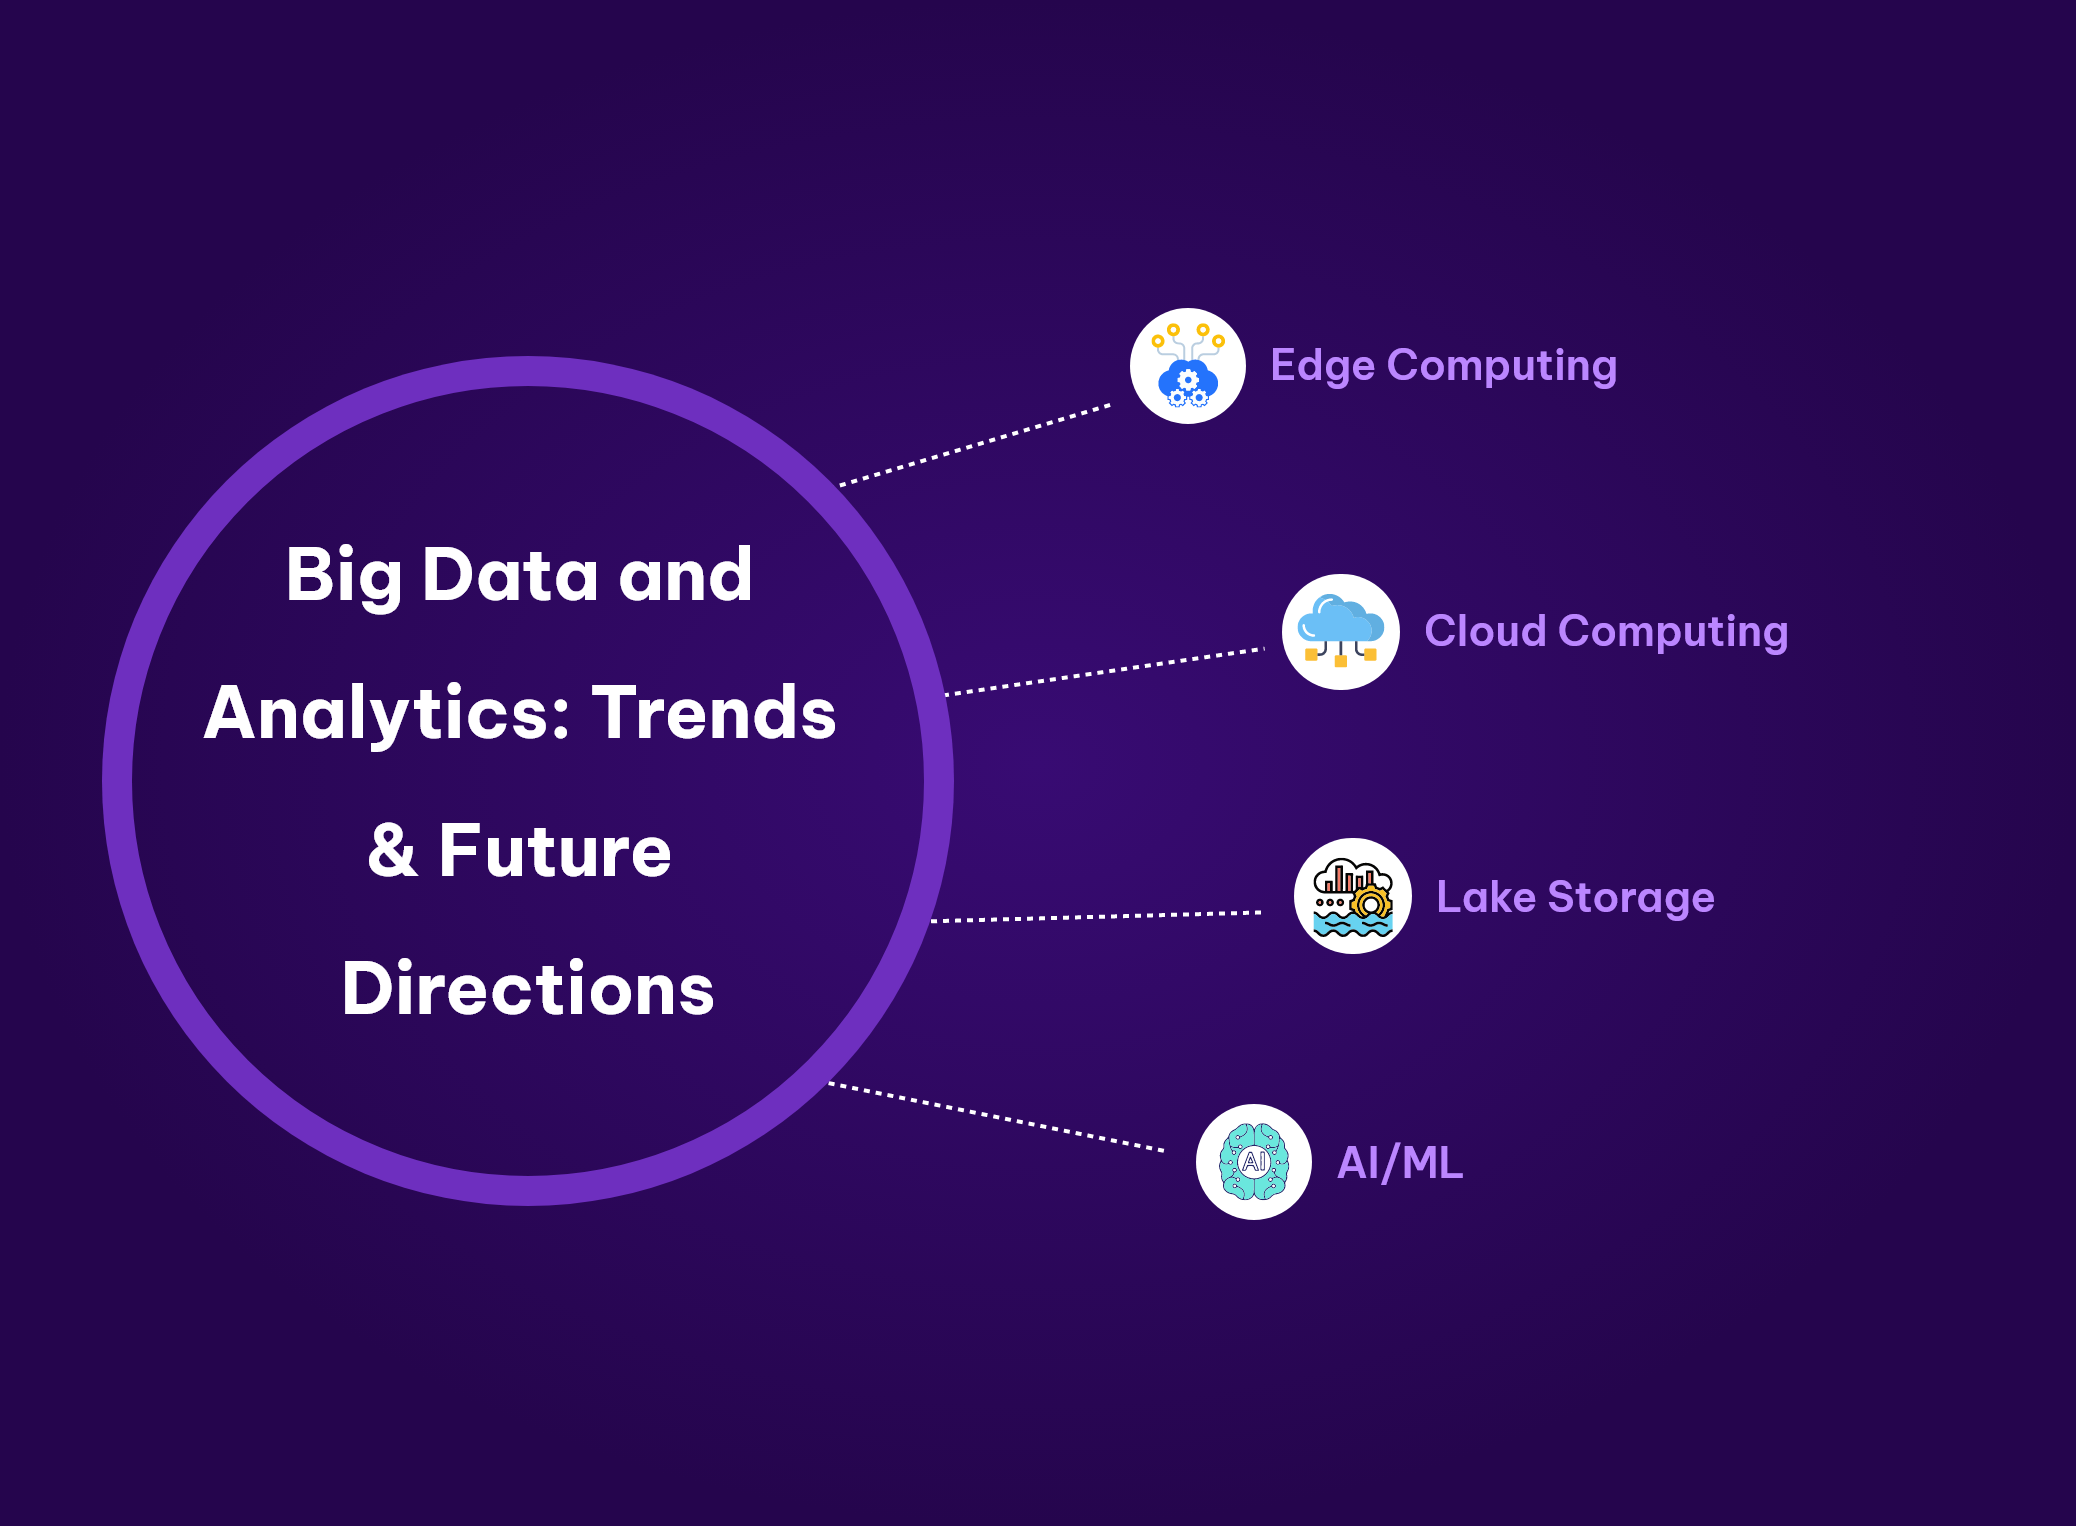
Data Analytics
|
16 February 2024
Big Data and Analytics: Trends and Future Directions
Big data is revolutionizing the way organizations process, store, and analyze information, leading to tangible....
Read More
Data Analytics
|
16 February 2024
The Essentials of Descriptive Analytics: A Beginner's Guide
As an umbrella concept, analytics helps businesses examine, analyse, and draw actionable insights from past in....
Read More
Data Analytics
|
16 February 2024
Data Analysis revolves around a Symbiotic Trio
Data analysis is not just a profession but an art form, intricately weaving together the fabric of reality wit....
Read More
Data Analytics
|
16 February 2024
Leveraging Business Intelligence in Retail Industry
Innovation in technology is advancing more quickly than before, and the digital revolution is having an impact....
Read More
Data Analytics
|
16 February 2024
Optimization Techniques for Power BI
Power BI stands as a powerhouse for business intelligence. However, to harness its full potential, it's crucia....
Read More
Data Analytics
|
16 February 2024
Automate Email reports with Microsoft Power Automate
Data shapes our professional choices and daily activities, offering insights into where to allocate time and r....
Read More
Data Analytics
|
16 February 2024
Big Data Processing with Apache Spark — the last journey through a fragmented data world
In today's business landscape, harnessing the power of big data is essential for driving innovation and genera....
Read More
Data Analytics
|
16 February 2024
Build a Learning Analytics Suite in 2024 for your Learning Management System
To foster a thriving learning culture, it's crucial to stay connected with your learners. Learning Management ....
Read More
Data Analytics
|
16 February 2024
Advanced SQL Techniques for Data Analyst
In the world of database management, mastering advanced SQL techniques can significantly enhance your ability ....
Read More
Data Analytics
|
16 February 2024
The Future of Healthcare: Predictive Analytics for Personalized Medicine
In healthcare, technological advancements are playing a vital role in shaping the future of patient care. One ....
Read More
Data Analytics
|
16 February 2024
Data Analytics in the Entertainment Industry: A Game Changer
In the ever-evolving landscape of the entertainment industry, staying ahead of the curve is paramount for succ....
Read More
Data Analytics
|
16 February 2024
Digital Transformation for Businesses
Digital transformation has become an essential driver for success in today's world. It is the process of digit....
Read More
Data Analytics
|
16 February 2024
Optimizing Data Warehousing Solutions with Azure: In22labs' Billion-Data Challenge
In the field of data warehousing, effectively managing enormous volumes of unique data is a difficult task. We....
Read More
Data Analytics
|
16 February 2024
Synthetic Data Generation: Methods, Applications, and Quality Assurance
In today's data-centric landscape, synthetic data emerges as a crucial asset for organizations seeking to na....
Read More
Data Analytics
|
16 February 2024
How In22Labs Transformed Reporting and Monitoring for a Leading Chit Fund Company
In22Labs partnered with a leading Indian chit fund company to elevate their reporting from paper to digital wi....
Read More
Data Analytics
|
16 February 2024
Addressing Supply Chain Challenges with BI and Data Science Solutions
In today’s fast-paced, interconnected world, supply chains are the backbone of nearly every business, ensuring....
Read More
Data Analytics
|
16 February 2024
The Evolution of Customer Analytics in the Digital Age
In today's hyperconnected digital world, customer analytics has evolved into a cornerstone of business success....
Read More
Data Analytics
|
16 February 2024
Analytics in the Public Sector - Improving Government Sectors
In today's data-driven world, analytics has emerged as a game-changer for improving efficiency, decision-makin....
Read More